My Story
With over 2 years of experience in data analytics and reporting, I have empowered teams, directors, and C-level executives by providing data visibility through insightful dashboards and clear, impactful communication. I’ve managed end-to-end data operations, from data collection and analysis to hypothesis building, while identifying operational inefficiencies and areas for improvement.
I’ve played a pivotal company-wide role in maintaining data integrity by regularly auditing CRM databases to ensure accuracy and consistency. My work has supported data-driven decision-making across departments.
I’ve also implemented and utilized a diverse set of tools to ensure seamless workflows and reliable outputs. A few of the key platforms I’ve worked with include HubSpot, Zoho, Asana, Looker Studio, Power BI, Tableau, and GA4.
As a tech enthusiast, I quickly adapt to new tools and platforms, and I’m passionate about continuously expanding my technical skill set to stay ahead in the evolving world of data and analytics.
Shoaib Hassan

Experience
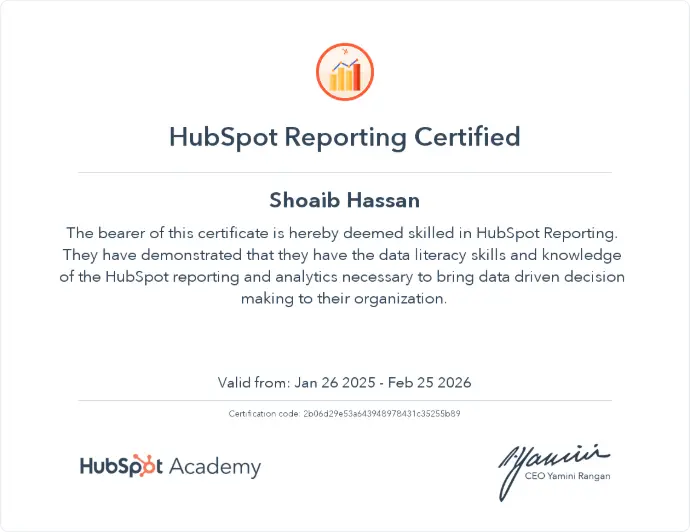
Certifications
Portfolio
Customer Analysis
Conducted customer analysis, which involved examining customer demographics such as gender, wealth segment, geographical location, industry, and age.
Type: Data Visualization | Tools: Google Sheets / Power BI
Sales Dashboard
Developed a sales dashboard that highlights key metrics such as sales, profits, orders, products with profits or losses, top customer cities, and detailed sales segmentation and categorization.
Type: Data Visualization | Tools: Microsoft Excel / Power BI
Global Terrorism
Created a dashboard analyzing terrorism data from the past 30 years, key metrics include total attacks, attacker groups, citizens killed and wounded, and property loss.
Type: Data Visualization | Tools: Excel / Power BI
More Details
Prediction Modeling
Performed advanced data collection and cleaning techniques, and developed machine learning model to predict sales using customer sales data.
Type: EDA & Visualization | Tools: PyCharm
More Details


