Mon Histoire
With over 2 years of experience in data analytics and reporting, I have empowered teams, directors, and C-level executives by providing data visibility through insightful dashboards and clear, impactful communication. I’ve managed end-to-end data operations, from data collection and analysis to hypothesis building, while identifying operational inefficiencies and areas for improvement.
I’ve played a pivotal company-wide role in maintaining data integrity by regularly auditing CRM databases to ensure accuracy and consistency. My work has supported data-driven decision-making across departments.
I’ve also implemented and utilized a diverse set of tools to ensure seamless workflows and reliable outputs. A few of the key platforms I’ve worked with include HubSpot, Zoho, Asana, Looker Studio, Power BI, Tableau, and GA4.
As a tech enthusiast, I quickly adapt to new tools and platforms, and I’m passionate about continuously expanding my technical skill set to stay ahead in the evolving world of data and analytics.
Shoaib Hassan

Expérience
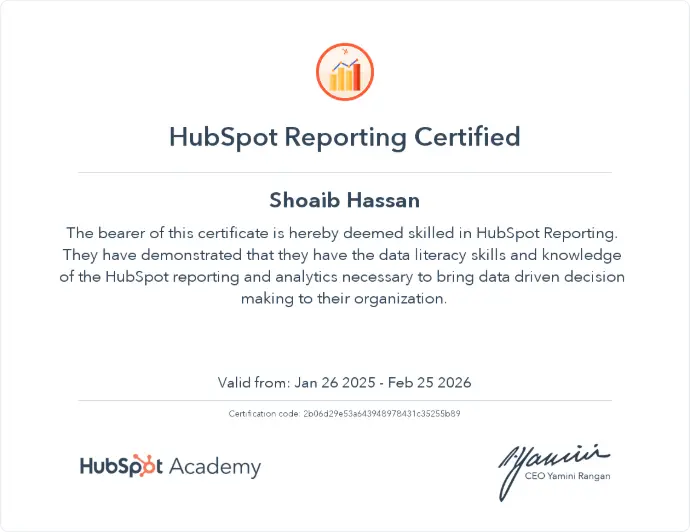
Certifications
Portefeuille
Analyse des clients
Réalisation d'une analyse des clients, qui impliquait l'examen des données démographiques des clients telles que le sexe, le segment de richesse, la localisation géographique, l'industrie et l'âge.
Type : Visualisation de données | Outils : Google Sheets / Power BI
Tableau de bord des ventes
Développé un tableau de bord des ventes qui met en évidence des indicateurs clés tels que les ventes, les bénéfices, les commandes, les produits avec bénéfices ou pertes, les principales villes clientes, ainsi qu'une segmentation et une catégorisation détaillées des ventes.
Type : Visualisation des données | Outils : Microsoft Excel / Power BI
Le terrorisme mondial
Créé un tableau de bord analysant les données sur le terrorisme des 30 dernières années, les indicateurs clés incluent le nombre total d'attaques, les groupes d'attaquants, les citoyens tués et blessés, et les pertes matérielles.
Type : Visualisation de données | Outils : Excel / Power BI
Plus de détailsModélisation de la prédiction
A effectué des techniques avancées de collecte et de nettoyage des données, et a développé un modèle d'apprentissage automatique pour prédire les ventes en utilisant les données de ventes des clients.
Type: EDA & Visualization | Tools: PyCharm
Plus de détails


