Meine Geschichte
With over 2 years of experience in data analytics and reporting, I have empowered teams, directors, and C-level executives by providing data visibility through insightful dashboards and clear, impactful communication. I’ve managed end-to-end data operations, from data collection and analysis to hypothesis building, while identifying operational inefficiencies and areas for improvement.
I’ve played a pivotal company-wide role in maintaining data integrity by regularly auditing CRM databases to ensure accuracy and consistency. My work has supported data-driven decision-making across departments.
I’ve also implemented and utilized a diverse set of tools to ensure seamless workflows and reliable outputs. A few of the key platforms I’ve worked with include HubSpot, Zoho, Asana, Looker Studio, Power BI, Tableau, and GA4.
As a tech enthusiast, I quickly adapt to new tools and platforms, and I’m passionate about continuously expanding my technical skill set to stay ahead in the evolving world of data and analytics.
Shoaib Hassan

Erfahrung
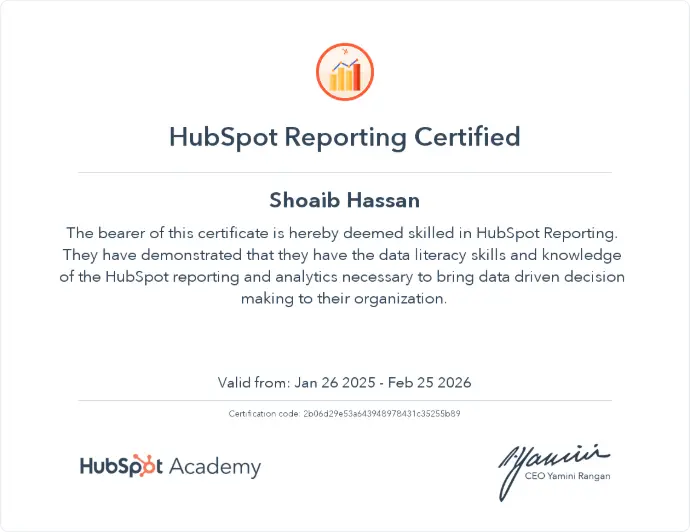
Zertifizierungen
Portfolio
Kundenanalyse
Durchführung einer Kundenanalyse, die die Untersuchung von Kundendemografien wie Geschlecht, Vermögenssegment, geografischer Lage, Branche und Alter umfasste.
Typ: Datenvisualisierung | Werkzeuge: Google Sheets / Power BI
Verkaufs-Dashboard
Entwickelte ein Vertriebs-Dashboard, das wichtige Kennzahlen wie Umsatz, Gewinne, Bestellungen, Produkte mit Gewinnen oder Verlusten, die wichtigsten Kundenstädte sowie eine detaillierte Vertriebssegmentierung und -kategorisierung hervorhebt.
Typ: Datenvisualisierung | Werkzeuge: Microsoft Excel / Power BI
Globaler Terrorismus
Ein Dashboard erstellt, das Terrorismusdaten der letzten 30 Jahre analysiert. Wichtige Kennzahlen umfassen die Gesamtzahl der Angriffe, Angreifergruppen, getötete und verwundete Bürger sowie Sachschäden.
Typ: Datenvisualisierung | Werkzeuge: Excel / Power BI
Mehr DetailsVorhersagemodellierung
Durchführung fortgeschrittener Datenbeschaffungs- und Reinigungsverfahren sowie Entwicklung eines maschinellen Lernmodells zur Vorhersage von Verkäufen anhand von Kundendaten.
Typ: EDA & Visualisierung | Werkzeuge: PyCharm
Mehr Details


